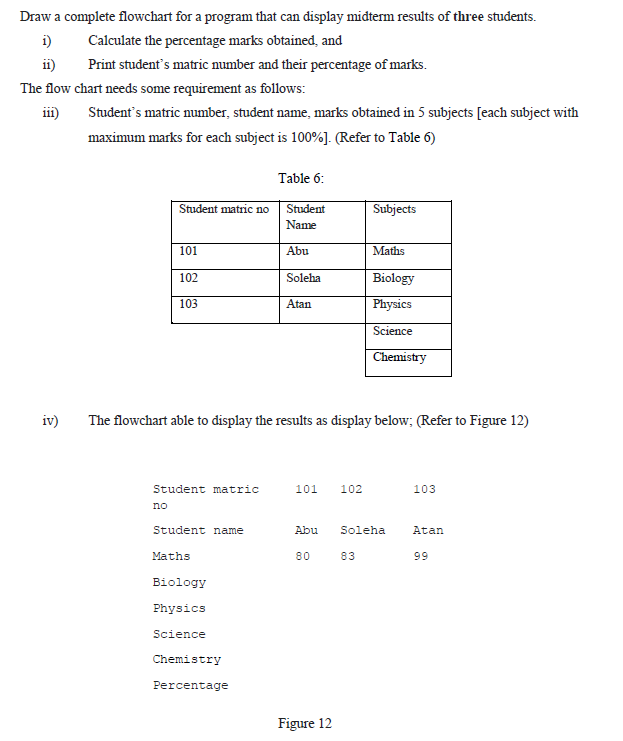
Draw a complete flowchart for a program that can display midterm results of three students. i) Calculate the percentage marks obtained, and ii) Print student's matric number and their percentage of marks. The flow chart needs some requirement as follows: 111) Student's matric number, student name, marks obtained in 5 subjects (each subject with maximum marks for each subject is 100%). (Refer to Table 6) Table 6: Student matric no Student Name Subjects 101 Abu Maths 102 Soleha Biology Physics 103 Atan Science Chemistry iv) The flowchart able to display the results as display below; (Refer to Figure 12) Student matric 101 102 103 no Student name Abu Soleha Atan 99 80 83 Maths Biology Physics Science Chemistry Percentage Figure 12
没有找到相关结果