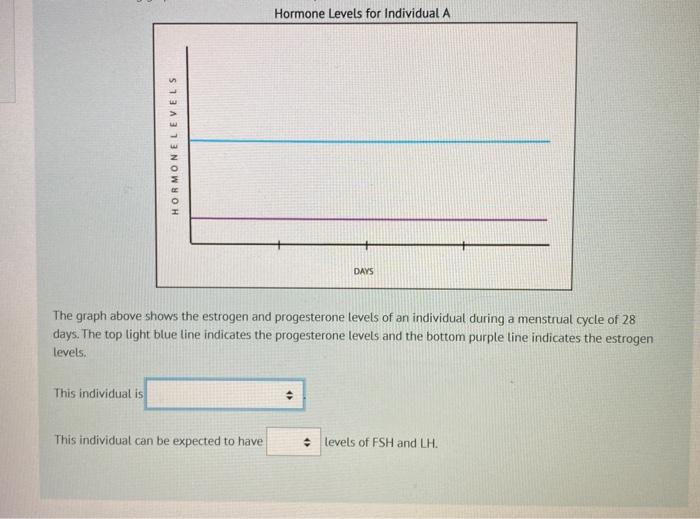
Hormone Levels for Individual A HORMONE LEVELS DAYS The graph above shows the estrogen and progesterone levels of an individual during a menstrual cycle of 28 days. The top light blue line indicates the progesterone levels and the bottom purple line indicates the estrogen levels. This individual is This individual can be expected to have levels of FSH and LH.
What is the expected effect on reproduction on an individual with hormone levels shown above? Identify two physiological changes that will not occur due to the atypical hormone levels shown above. (2 marks) АА" O. B І III E Inil om 5 U S X2 x2 를 들 lili I эс + С Q I
没有找到相关结果