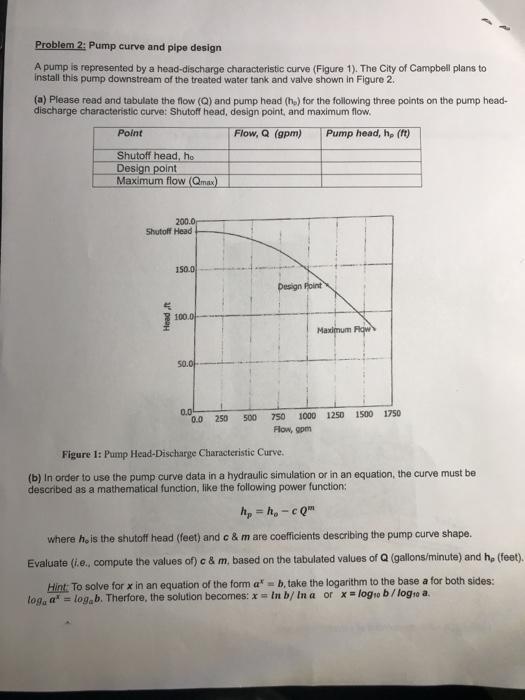
Problem 2: Pump curve and pipe design A pump is represented by a head-discharge characteristic curve (Figure 1). The City of Campbell plans to Install this pump downstream of the treated water tank and valve shown in Figure 2. (a) Please read and tabulate the flow (Q) and pump head (ho) for the following three points on the pump head- discharge characteristic curve: Shutoff head, design point and maximum flow. Point Flow, Q (opm) Pump head, he (1) Shutoff head, he Design point Maximum flow (Qmax) 200.0 Shutoff Head 150.0 Design Point 100.0 Maximum Flow 50.0 500 0.0 0.0 250 750 1000 1250 1500 1750 Flow, gpm Figure 1: Pump Head-Discharge Characteristic Curve. (b) In order to use the pump curve data in a hydraulic simulation or in an equation, the curve must be described as a mathematical function, like the following power function: h, -h-cm where he is the shutoff head (feet) and c & mare coefficients describing the pump curve shape. Evaluate (ie, compute the values of) c & m based on the tabulated values of Q (gallons/minute) and h, (feet). Hint: To solve for x in an equation of the form a' - b, take the logarithm to the base a for both sides: loga' = logab. Therfore, the solution becomes: x = lnb/ In a or x = logo b/log: a.
没有找到相关结果