Use The Data In The Table 1 To Plot A Graph Of Area, A, Versus Capacitance, C. For Table 1 Find The Permittity Of Free Space, ε0 From The Slope Of The Graph. For Table 1 Calculate The Percent Error In ε0. Take ε0=8.85X10⁻¹² C2/N.m2 Use The Data In Table
- Use the data in the table 1 to plot a graph of area, A, versusCapacitance, C.
- for table 1 Find the permittity of free space,ε0 from the slope of thegraph.
- for table 1 Calculate the percent error inε0.Takeε0=8.85X10⁻¹²C2/N.m2
- Use the data in table 2 to plot a graph between 1/d and thecapacitance C.
- for table 2 Find the permittity of free space,ε0 from the slope of thegraph.
- for table 2 Calculate the percent error inε0.Takeε0=8.85X10⁻¹²C2/N.m2
PLEASE WRITE YOUR SOLUTİONS HAND WRITTEN NOT COMPUTER
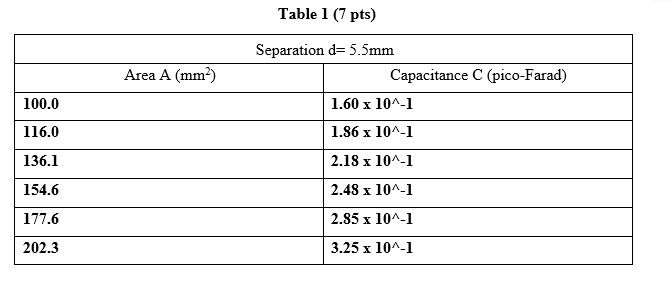
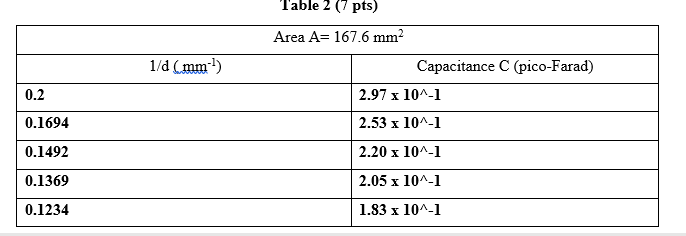
Table 1 (7 pts) Area A (mm) 100.0 116.0 Separation d= 5.5mm Capacitance C (pico-Farad) 1.60 x 10^-1 1.86 x 10^-1 2.18 x 10^-1 136.1 154.6 2.48 x 10^-1 177.6 2.85 x 10⁴-1 202.3 3.25 x 10⁴-1
Table 2 (7 pts) 1/d (mm ) Area A= 167.6 mm Capacitance C (pico-Farad) 2.97 x 10^-1 0.2 0.1694 0.1492 2.53 x 10^-1 2.20 x 10^-1 2.05 x 10⁴-1 0.1369 0.1234 1.83 x 10^-1