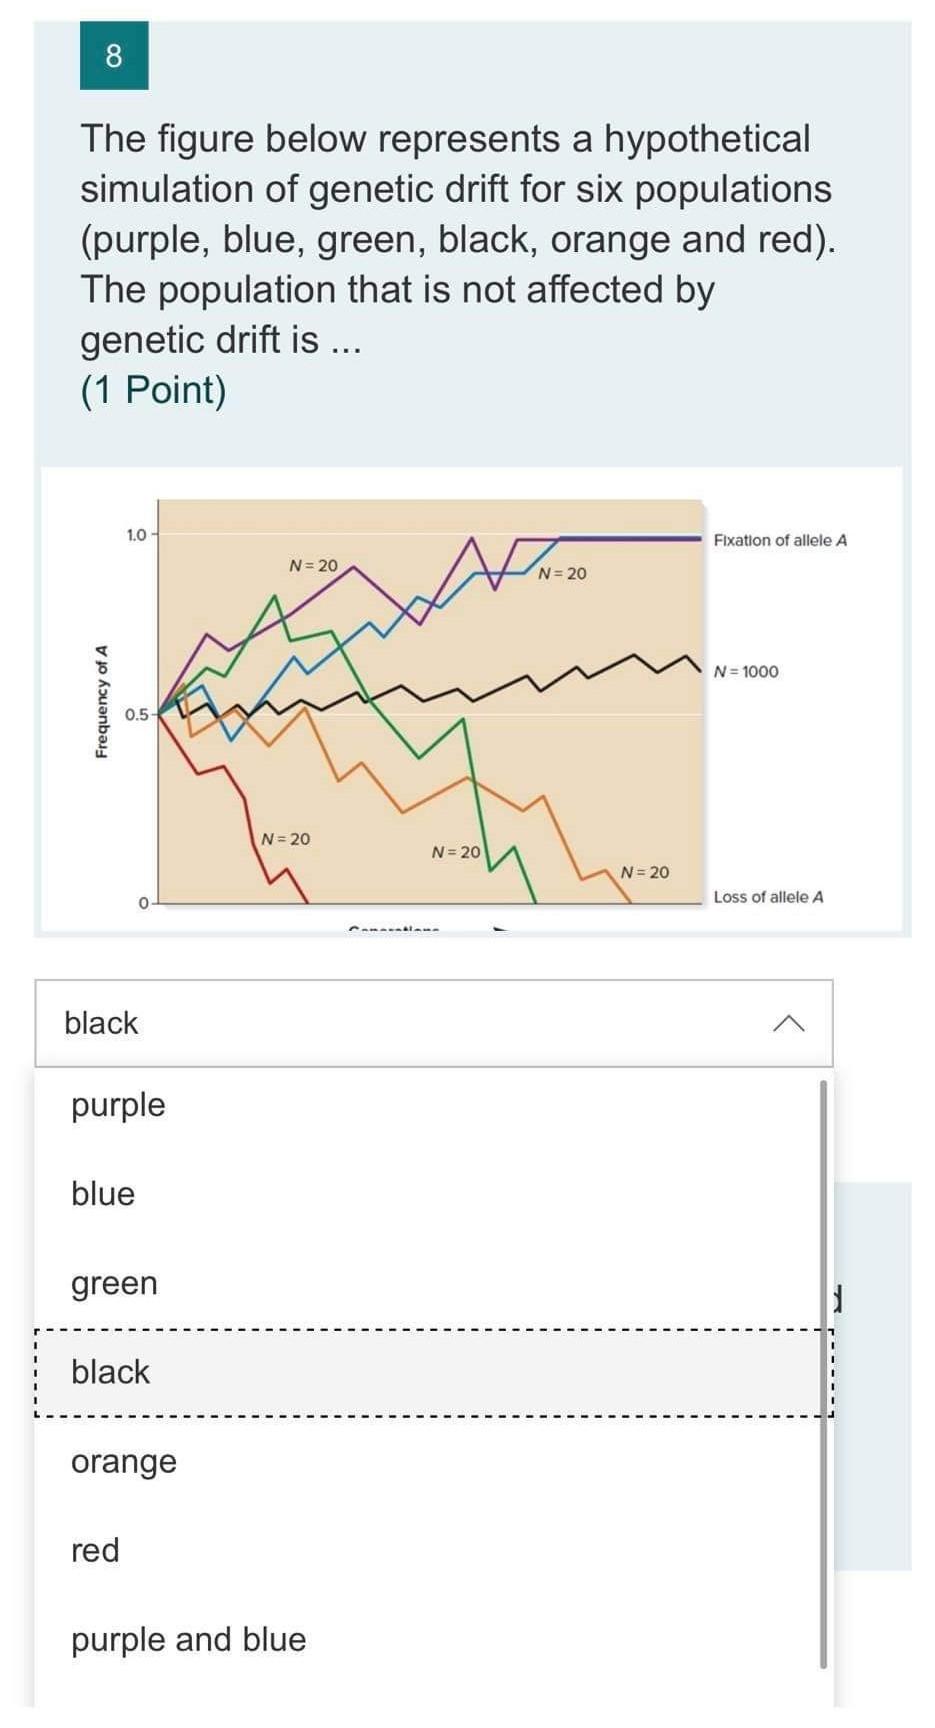
8 The figure below represents a hypothetical simulation of genetic drift for six populations (purple, blue, green, black, orange and red). The population that is not affected by genetic drift is ... (1 Point) 1.0 Fixation of allele A N= 20 N=20 N=1000 Frequency of A 0.5 N = 20 N = 20 N = 20 Loss of allele A black purple blue green black orange red purple and blue
没有找到相关结果