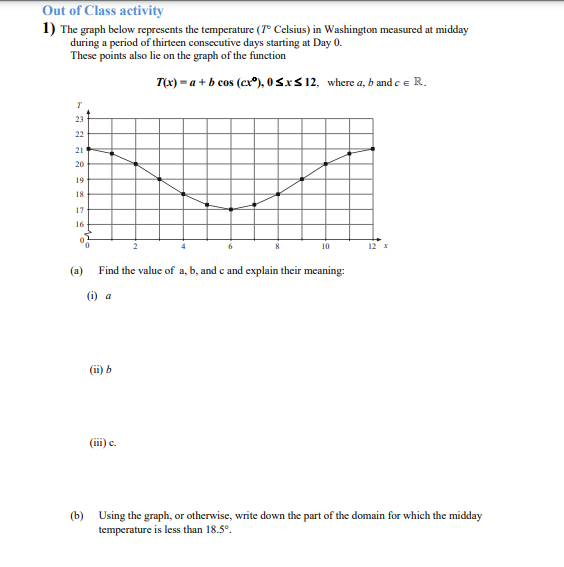
Out of Class activity 1) The graph below represents the temperature (T Celsius) in Washington measured at midday during a period of thirteen consecutive days starting at Day 0. These points also lie on the graph of the function T(x) = a +b cos (cº),05x512, where a, b and c E R. T 23 22 21 20 19 18 17 16 0 6 8 10 (a) Find the value of a, b, and c and explain their meaning: (i) a (ii) b (11) c. (b) Using the graph, or otherwise, write down the part of the domain for which the midday temperature is less than 18.5º.
没有找到相关结果