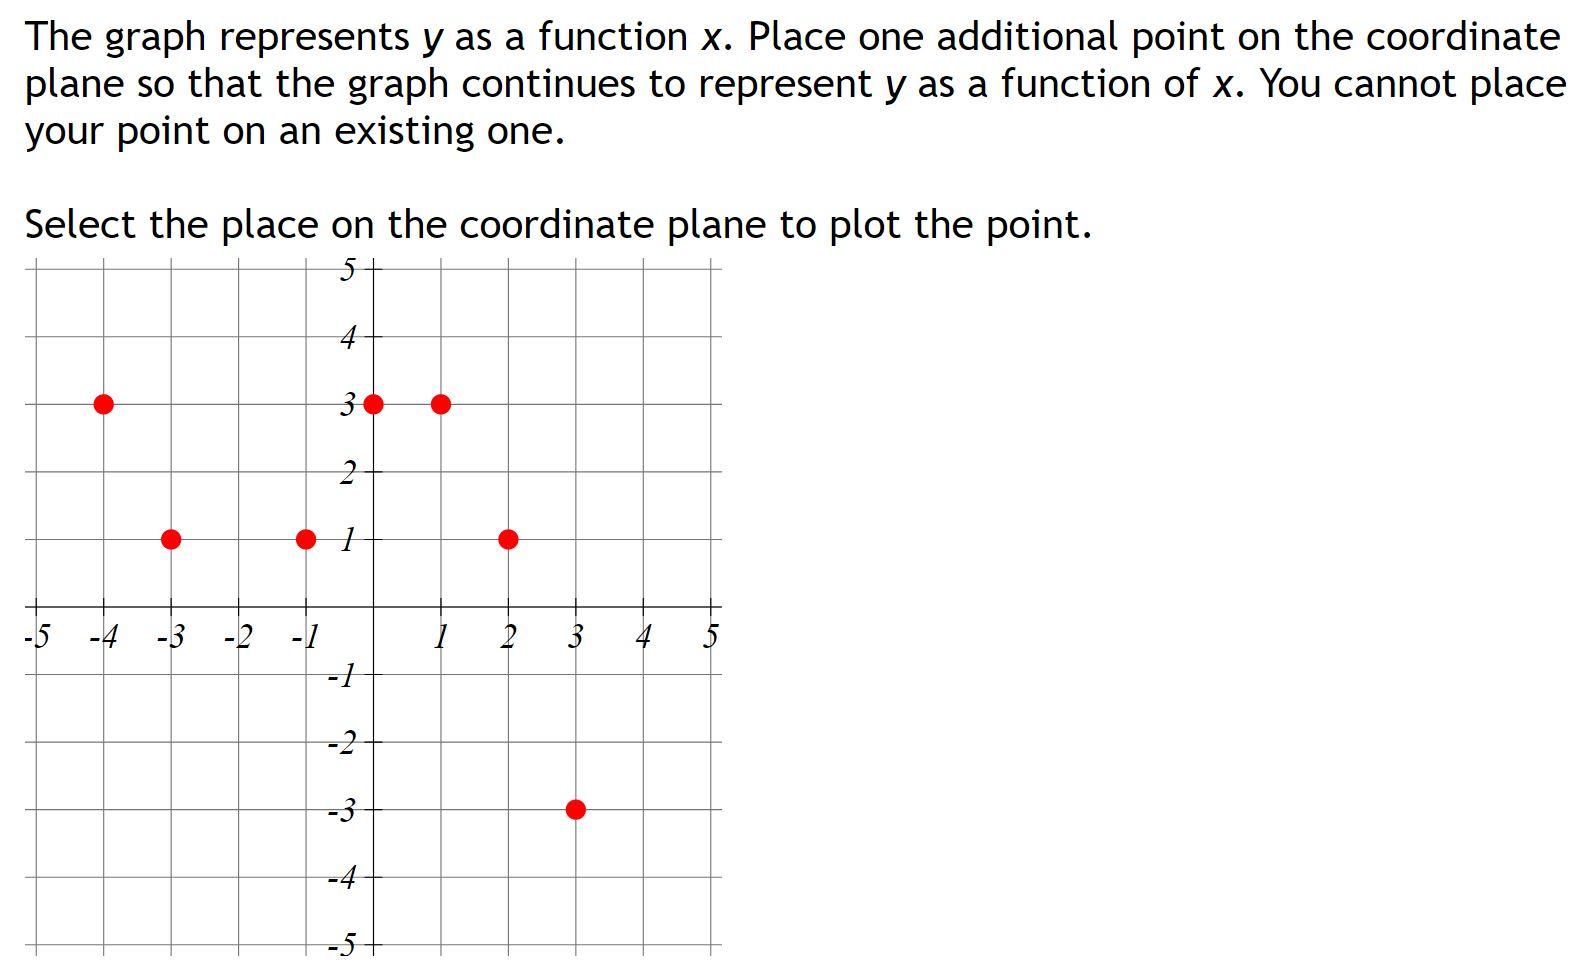
The graph represents y as a function x. Place one additional point on the coordinate plane so that the graph continues to represent y as a function of x. You cannot place your point on an existing one. Select the place on the coordinate plane to plot the point. 5 4 3 2 1 -5 -4 -3 -2 2 3 -1 3 -5
没有找到相关结果