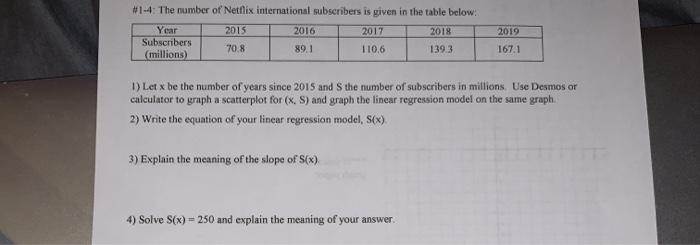
#1-4: The number of Netflix international subscribers is given in the table below: Year 2015 2016 2017 2018 Subscribers 70.8 89.1 110,6 1393 (millions) 2019 167.1 1) Let x be the number of years since 2015 and the number of subscribers in millions Use Desmos or calculator to graph a scatterplot for (x. S) and graph the linear regression model on the same graph. 2) Write the equation of your linear regression model, sex) 3) Explain the meaning of the slope of S(x) 4) Solve S(x) = 250 and explain the meaning of your answer
没有找到相关结果