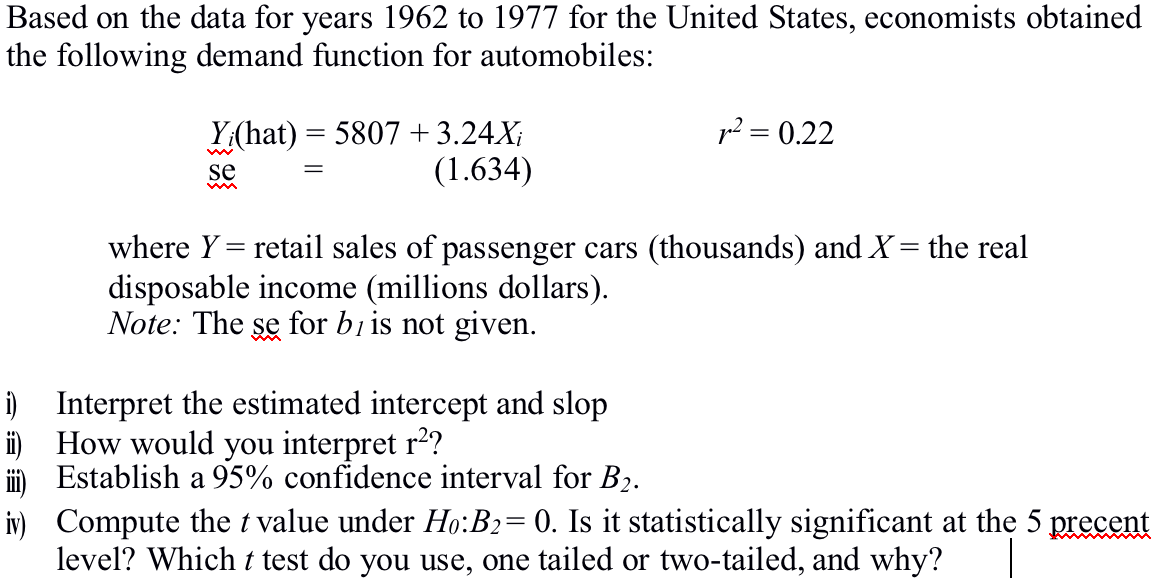
Based on the data for years 1962 to 1977 for the United States, economists obtained the following demand function for automobiles: p2 = 0.22 Yi(hat) = 5807 + 3.24X; (1.634) se where Y = retail sales of passenger cars (thousands) and X = the real disposable income (millions dollars). Note: The se for bi is not given. i) Interpret the estimated intercept and slop ii ) How would you interpret r?? ii) Establish a 95% confidence interval for B2. iv) Compute the t value under Ho:B2= 0. Is it statistically significant at the 5 prevent level? Which t test do you use, one tailed or two-tailed, and why?
没有找到相关结果