could someone help 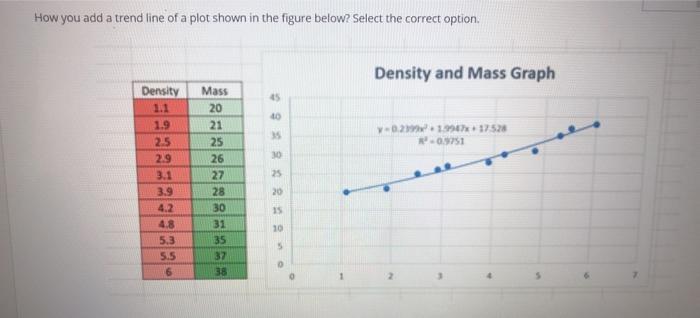
How you add a trend line of a plot shown in the figure below? Select the correct option. Density and Mass Graph 45 10 35 Y.02.1994 17528 **0.951 Density 1.1 1.9 2.5 2.9 3.1 3.9 4.2 30 Mass 20 21 25 26 27 28 30 31 35 37 38 20 10 5 5.3 5.5 6 1 O A. Select point in the graph and right click> add trendline> Trendline options polynomial OB. Select point in the graph and right click> add trendline> Trendline options>linear OC. Select point in the graph and right click> add trendline> Trendline options>logarithmic O D. Select point in the graph and right click> add trendline> Trendline options>exponential
没有找到相关结果