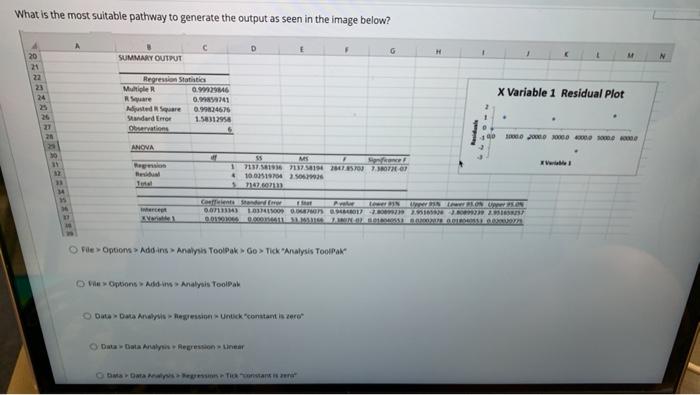
What is the most suitable pathway to generate the output as seen in the image below? G SUMMARY OUTPUT 20 21 22 23 24 Regression Statistics Multiple R 0.96 0.241 Mare 0.9724676 Standard Error 1.58312956 X Variable 1 Residual Plot 26 0 000 000 ANOVA 11 Region 1 8 MS 7137.18 71370194 27SOU ROTH OF 10.02519704 SO 7102020 Tel 14 we 0.071334) 1 0.00022 PRONOS O Re > Option Add ins Analysis ToolPak Go > Tick "Analysis Tolak Option Add-> Analysis Toolpo De Data Analysis Begression Unuck constant is zero D Data AnalyRegression - Unear station
没有找到相关结果