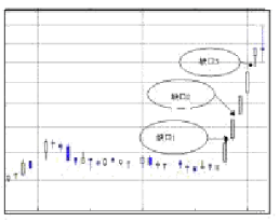
The chart below shows a stock's daily K-line trend.
(1) What is gap ?
(2) What types of gap are gap 1, gap 2, and gap 3? What is the market meaning of each? (The solid K line is the negative line, the hollow K line is

the positive line)
没有找到相关结果