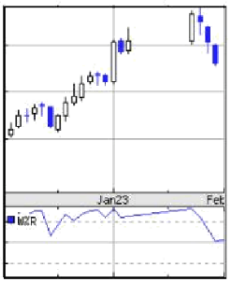
The following chart shows the daily K-line chart and William index chart of a stock. Please use the K-line theory combined with William index to analyze the possible future trend of the stock and the corresponding operation strategy.
(The solid K line is the negative line, the hollow K line is the positive line)

没有找到相关结果