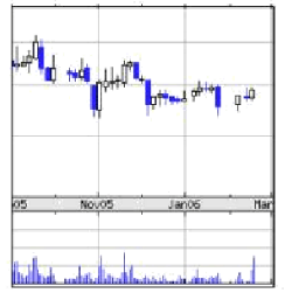
The following figure is the daily K-line trend chart of a stock. Please analyze the trend pattern of this stock by using the form theory in securities investment technical analysis, describe the characteristics of this form and predict the future trend of the stock price. (The solid K line is the negative line, the hollow K line is the positive line)

没有找到相关结果