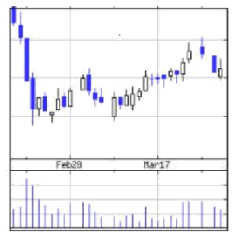
The chart below shows the daily K-line trend of a stock. Please use the form theory in security investment technical analysis to predict the trend of this stock price for a period of time henceforth. (The solid K line is the negative line, the hollow K line is the positive line)

没有找到相关结果