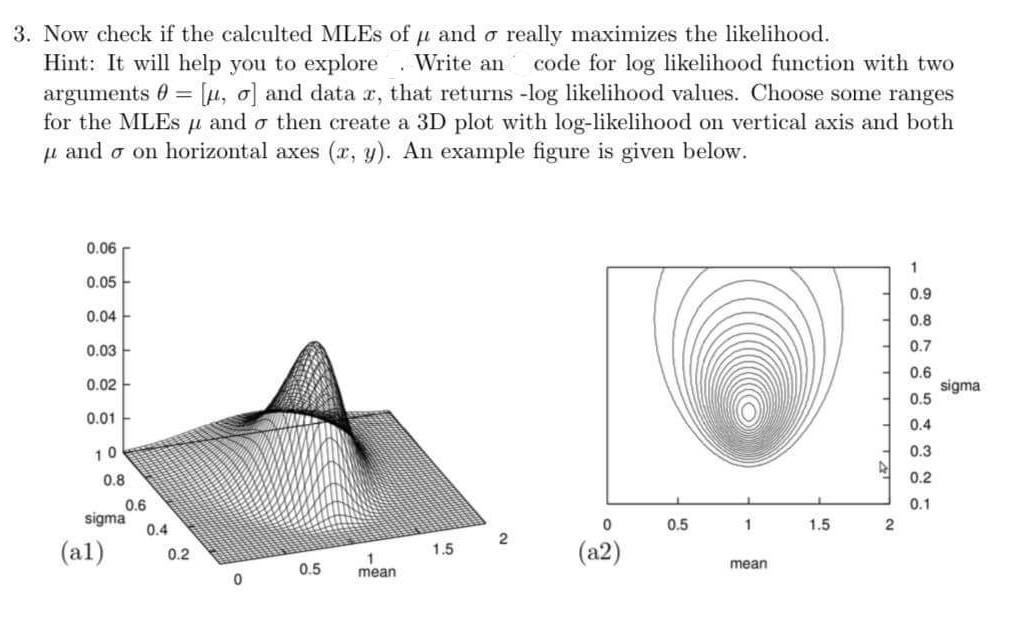
3. Now check if the calculted MLEs of u and o really maximizes the likelihood. Hint: It will help you to explore Write an code for log likelihood function with two arguments 0 = [u, o] and data z, that returns -log likelihood values. Choose some ranges for the MLEs p and o then create a 3D plot with log-likelihood on vertical axis and both Hi and o on horizontal axes (x, y). An example figure is given below. 0.06 1 0.05 0.9 0.04 0.8 0.03 0.7 0.02 0.6 sigma 0.5 0.01 0.4 10 0.3 0.8 0.2 0.1 0.6 sigma 0.4 0 0.5 1 1.5 2 2 (al) 0.2 1.5 1 mean (a2) 0.5 mean 0
没有找到相关结果