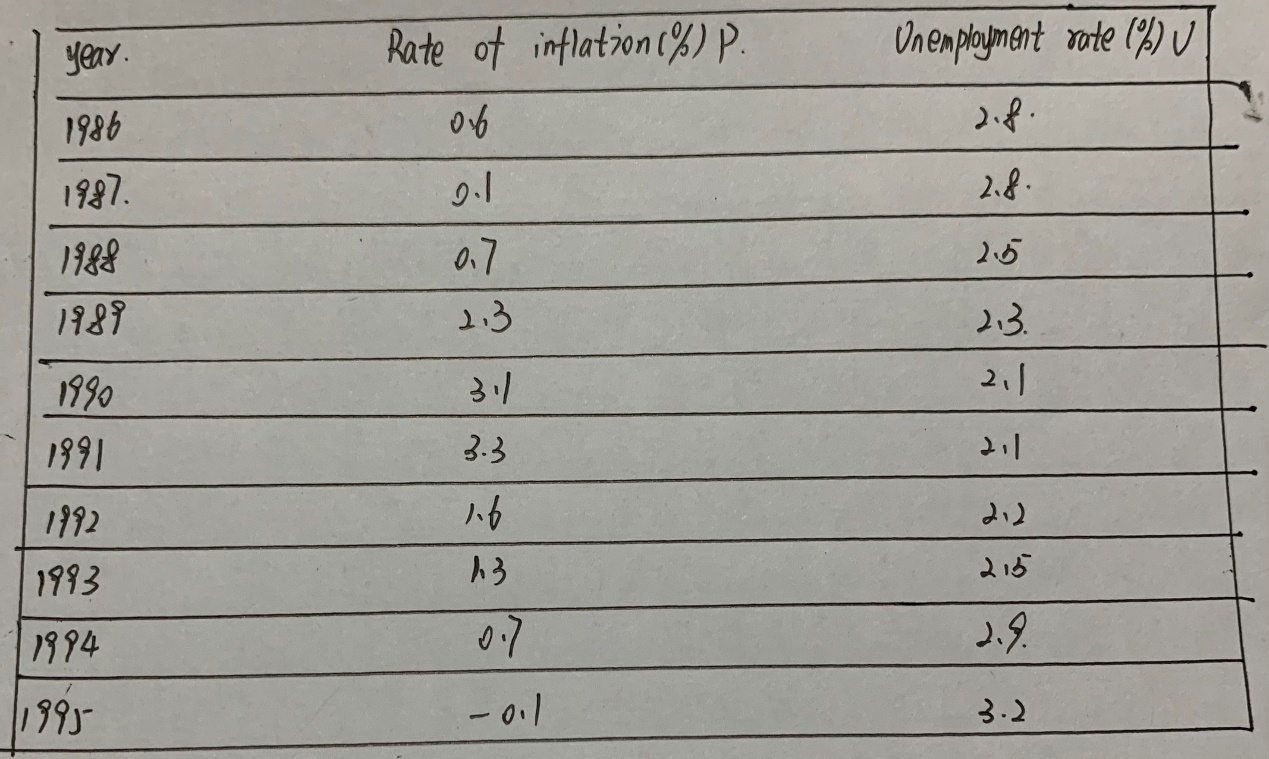
There is the following table:
The relationship between rising price rate and unemployment rate in Japan.

(1) Let the horizontal axis be U and the vertical axis be P to draw a scatter diagram. Judging by the graph, what is the relationship between the rising rate of prices and the unemployment rate? What kind of model is suitable for fitting?
(2) According to the above data, the following two models are fitted:.

没有找到相关结果