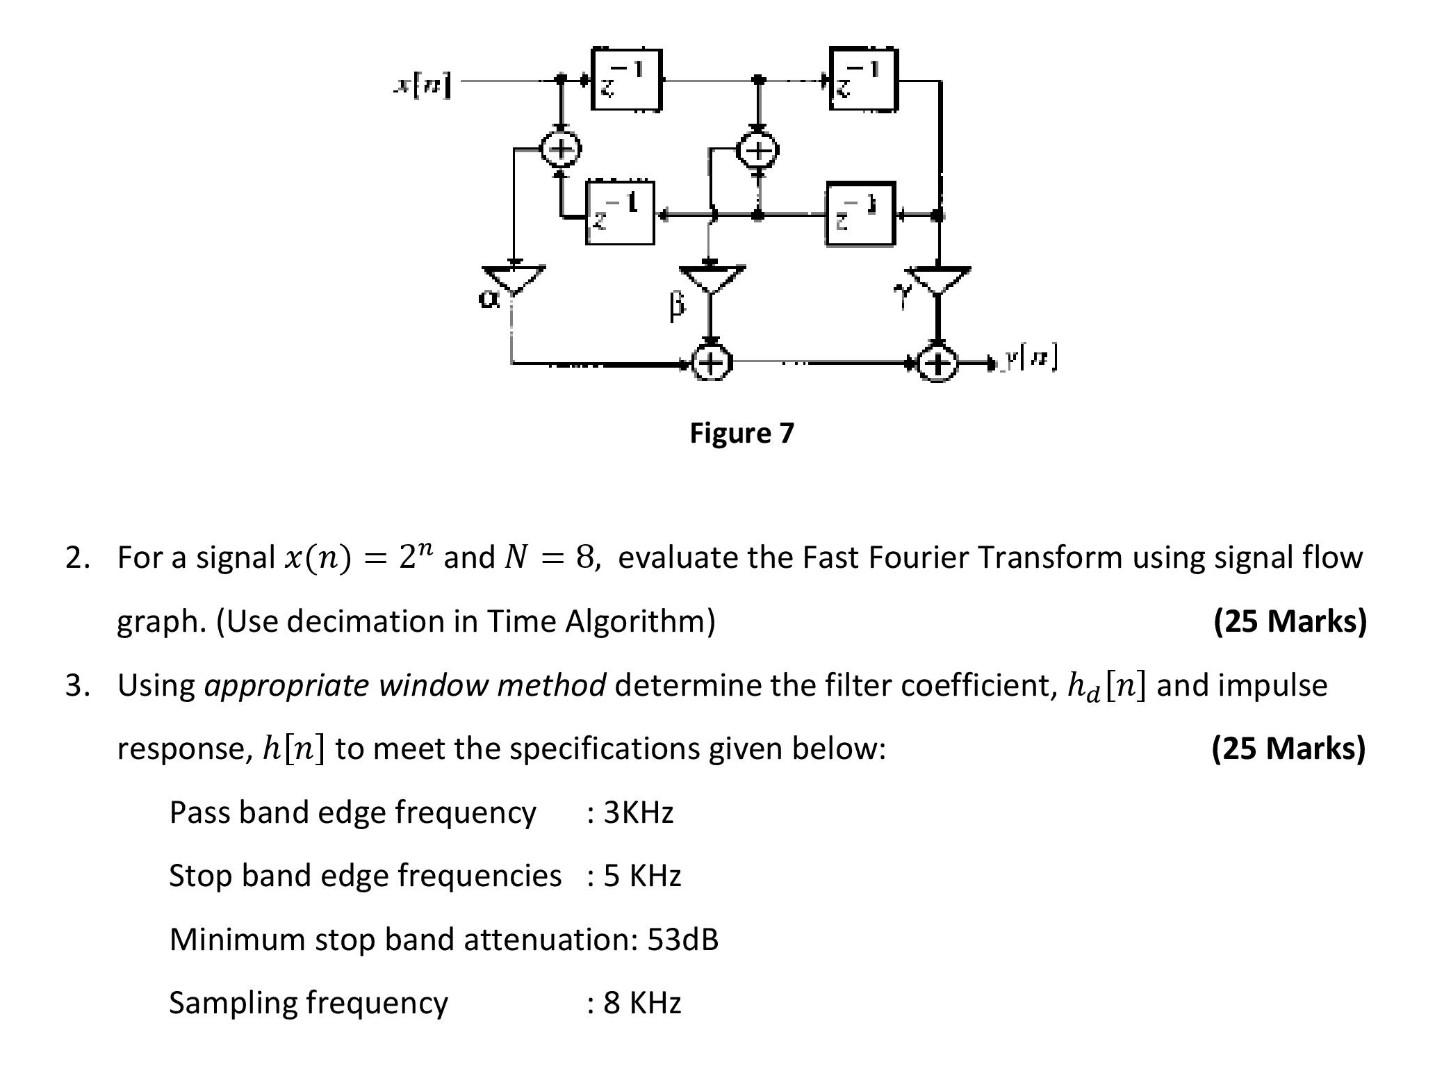
Z V Figure 7 2. For a signal x(n) = 2” and N 8, evaluate the Fast Fourier Transform using signal flow graph. (Use decimation in Time Algorithm) (25 Marks) 3. Using appropriate window method determine the filter coefficient, hd [n] and impulse response, h[n] to meet the specifications given below: (25 Marks) Pass band edge frequency : 3KHz Stop band edge frequencies : 5 KHz Minimum stop band attenuation: 53dB Sampling frequency : 8 KHz
没有找到相关结果