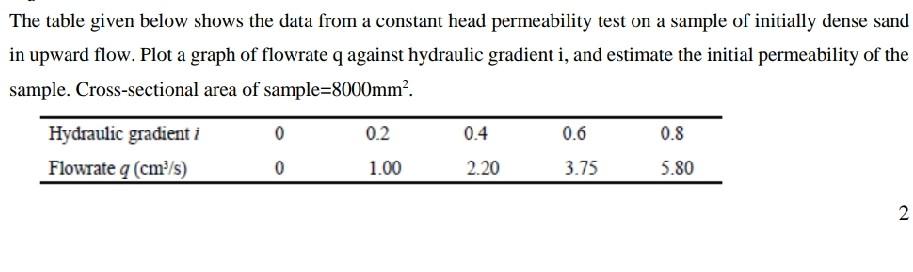
The table given below shows the data from a constant head permeability test on a sample of initially dense sand in upward flow. Plot a graph of flowrate q against hydraulic gradient i, and estimate the initial permeability of the sample. Cross-sectional area of sample=8000mm?. 0 0.2 0.4 0.6 0.8 Hydraulic gradient i Flowrate q (cm/s) 0 1.00 2.20 3.75 5.80 2
没有找到相关结果