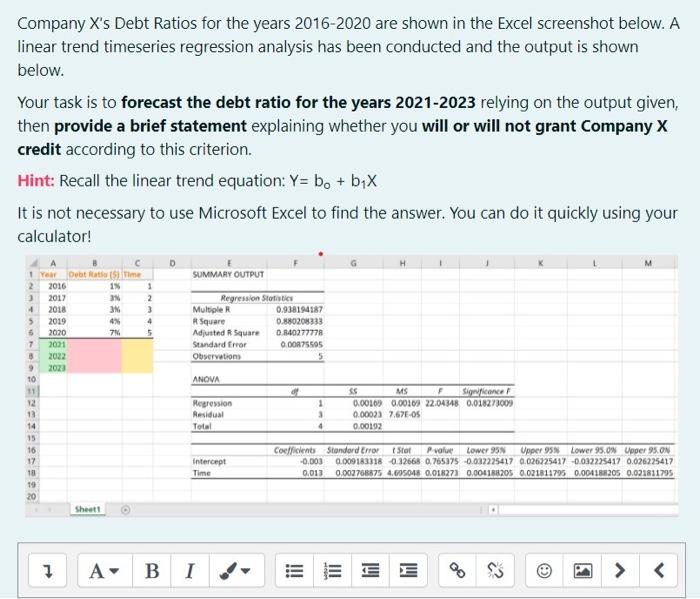
Company X's Debt Ratios for the years 2016-2020 are shown in the Excel screenshot below. A linear trend timeseries regression analysis has been conducted and the output is shown below. Your task is to forecast the debt ratio for the years 2021-2023 relying on the output given, then provide a brief statement explaining whether you will or will not grant Company X credit according to this criterion. Hint: Recall the linear trend equation: Y= bo + b1X It is not necessary to use Microsoft Excel to find the answer. You can do it quickly using your calculator! D SUMMARY OUTPUT 2 3 4 5 You Dot Ratio (9) Time 2016 13 1 2017 2 2018 3 3 2019 4 2020 7 5 2031 2022 2021 Regression Statistics Multiple 0.938194187 R Square 0.880208333 Adjusted Square 0 140277778 Standard Error 0.00075505 Observation 5 7 9 10 ANOVA 12 13 Regression Residual Total 1 3 4 SS MS F Sigficance 0.00109 0.00109 22.04348 0.018273009 0.00023 7.67E-OS 0.00192 15 16 17 18 Intercept Time Coefficients Standard Error Star Pyal Lower 95 Upper 95 Lower 95.0N Upper 95 ON -0.003 0.009183318 0.32668 0.765375 -0.002225417 0.026325417 -0.032225417 0.026225417 0.013 0.002768575 4.605048 0.018271 0.004188205 0.021811795 0.00418205 0.021811795 20 Sheet 1 A B I E E mil c? 9 > <
没有找到相关结果