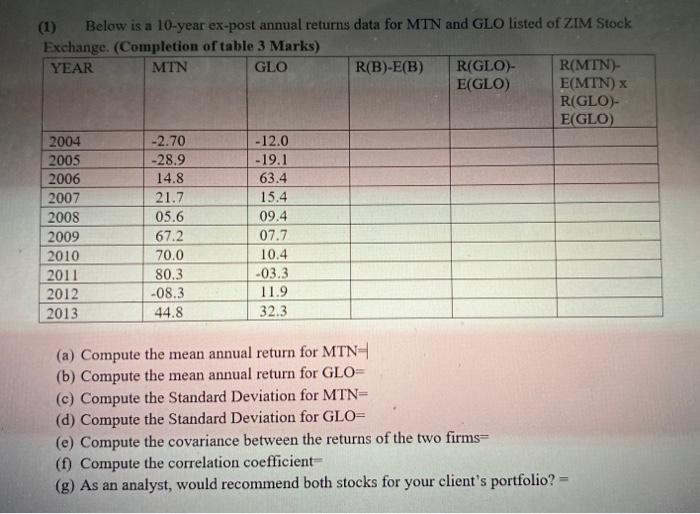
(1) Below is a 10-year ex-post annual returns data for MTN and GLO listed of ZIM Stock Exchange. (Completion of table 3 Marks) YEAR MTN GLO R(B)-E(B) R(GLO- R(MTN)- E(GLO) E(MTN) x R(GLO)- E(GLO) 2004 -2.70 - 12.0 2005 -28.9 -19.1 2006 14.8 63.4 2007 21.7 15.4 2008 05.6 09.4 2009 67.2 07.7 2010 70.0 10.4 2011 80.3 -03.3 2012 -08.3 11.9 2013 44.8 32.3 (a) Compute the mean annual return for MTN- (b) Compute the mean annual return for GLO (c) Compute the Standard Deviation for MTN- (d) Compute the Standard Deviation for GLON (e) Compute the covariance between the returns of the two firms (f) Compute the correlation coefficiente (g) As an analyst, would recommend both stocks for your client's portfolio?
没有找到相关结果