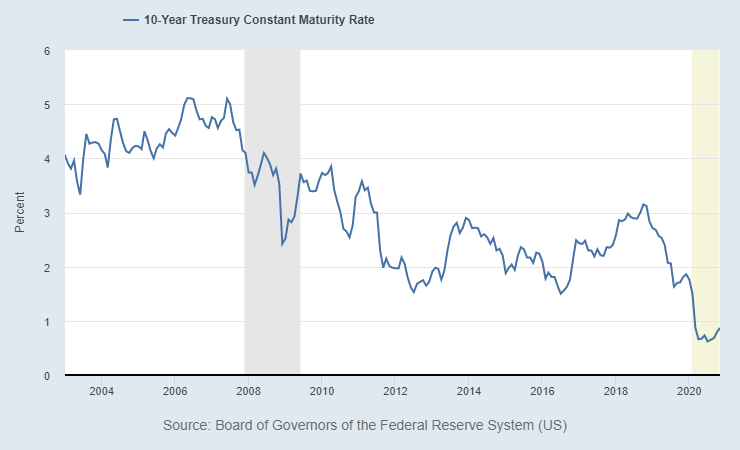
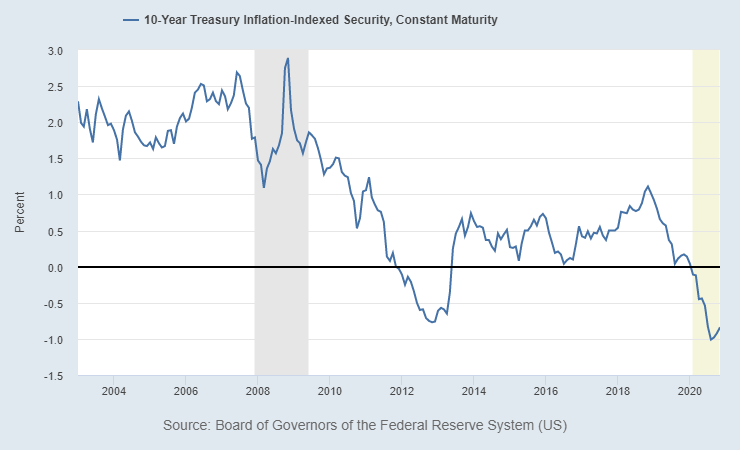
Describe the differences in yields between the two graphs.In what periods does inflation seem to be the highest? The lowest?Explanation should be as thorough as possible and should be atleast 1 paragraph.

匿名用户 最后更新于 2021-11-29 14:53 金融Finance

  1. Describe thedifferences in yields between the two graphs.In what periods does inflation seem to be the highest? The lowest?Explanationshould be as thorough as possible and should be atleast 1 paragraph.

10-Year Treasury Constant Maturity Rate 6 5 4 yhan Percent mu 3 2 1 2004 2006 2008 2010 2012 2014 2016 2018 2020 Source: Board of Governors of the Federal Reserve System (US) 10-Year Treasury Inflation Indexed Security, Constant Maturity 3.0 2.5 2.0 un 1.5 1.0 Percent 0.5 Mummm 0.0 -0.5 -1.0 -1.5 2004 2006 2008 2010 2012 2014 2016 2018 2020 Source: Board of Governors of the Federal Reserve System (US)

已邀请: