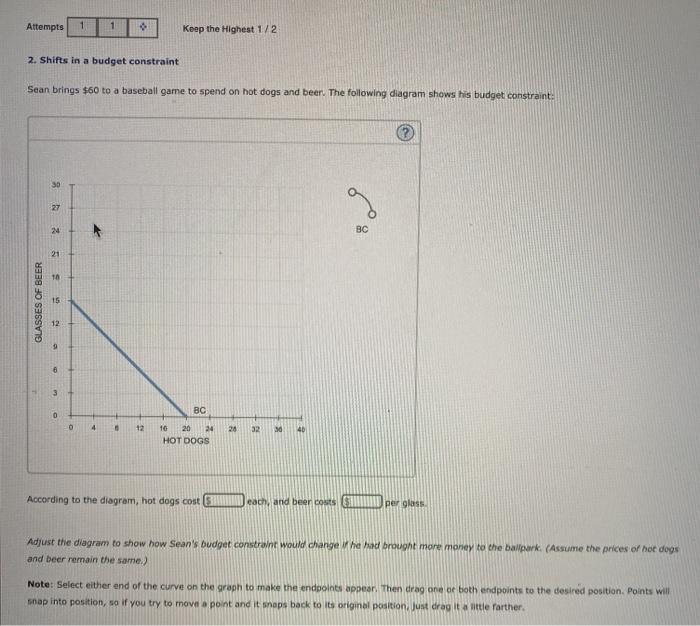
Attempts 1 1 ܀ Keep the Highest 1/2 2. Shifts in a budget constraint Sean brings $60 to a baseball game to spend on hot dogs and beer. The following diagram shows his budget constraint: 30 27 24 89 BC 21 10 GLASSES OF BEER 15 12 9 6 3 BC 0 0 4 12 24 32 8 16 20 24 HOT DOGS According to the diagram, hot dogs cost Heath, and beer costs CAD per glass Adjust the diagram to show how Sean's budget constraint would change he had brought more money to the ballpark (Assume the prices of hot dogs and beer remain the same.) Note: Select either end of the curve on the graph to make the endpoints appear. Then drag one of both endpoints to the desired position. Points will snap into position, so if you try to move a point and it snaps back to its original position, just drag it a little farther
没有找到相关结果